Demokrit Measurements

Vertical Response

Measurement conditions:

  • Middle of the reflector and mic 1.47m above ground like shown here.
  • No gating applied to frequency response plots
  • Excitation: Periodic noise
  • Mic distance: 1m
  • The setup allows for a 6.12 ms gate used for the polar response plot only. In addition, a 140Hz acoustical LR4 HP was in place.
  • Compared to the horizontal measurements, the equalization was changed slightly but it is still crude. Yet, I prefer to show graphs based on a reasonably flat response because they are easier to interpret.

Vertical response from listening position (here 0°) and up by 90° in 10° increments.

Vertical response from listening position (0°) and down by 90° in 10° increments.

Starting around 2KHz, the response becomes pretty agitated but it does not “fall apart” completely.
Yet, it is clear that the cone has to be situated at ear height.
Below are the responses drawn into polar maps. Listening position is again at 0° and negative angles correspond to “down”.

These are the vertical responses at 0°. Mic distance was 70cm. Without cone, the 6dB baffle step is clearly formed. The reflector adds another 2.5dB diffraction when transitioning from 2Pi into 3/4Pi radiation and the ascent becomes steeper.
Interestingly, the response with cone is smoother beyond the diffraction zone.

This is the listening window curve (red trace) compared to the on axis response (black). The listening window is an average of the following responses:

  • On axis
  • +10° vertically
  • -10° vertically
  • +10°...+30° horizontally
  • -10°...-30° horizontally

The calculated curve is clearly dominated by the uniform horizontal response.


Horizontal Response

Measurement conditions:

  • Middle of the reflector and mic 1.24m above ground.
  • No gating applied to frequency response plots
  • Excitation: Periodic noise
  • Mic distance: 75cm
  • The setup allows for a 5.35 ms gate used for the polar response and the directivity plot only

This is the unequalized response at 90°; the listeners position. There is a floor reflection @280Hz and subsequent ripples.
The best cone position has to be found empirically because it depends on the driver used. In this case it is now > 25 mm away from the deepest point of the membrane (not the dome). The black line is considered as a good starting point. Red represents a variation of + 1 mm and blue -1 mm. Equalization might become a bit tricky.

Here the 90° response is made flat. The equalization is pretty crude for now and as expected, the speaker sounds too bright.
But otherwise it does not sound bad at all ! You could expect that mids and highs somehow stick to the cone but this is not the case.

The equalized and now gated response was then used to calculate the directivity pattern and sonogram. The assumption is of course with only one measurement, that the horizontal response is always the same all around the speaker. This was validated with another measurement from a side with one of the supports in the way, which had no effect upon the frequency response.
The normalized response then leads to the funny but not incorrect pictures above. In the directivity plot, 12.5 KHz was only chosen as an example. The circle does not change no matter what frequency is selected; a result of normalization.


Preparation Measurements:

Impedance plots of the Vifa FR mounted in the stuffed pipe:

There are no visible signs of pipe resonances or other shortcomings in the impedance plots.

The 0° near field response of one brand new FR driver without reflector:

Between 1 and 2KHz the remaining diffraction from the pipe is visible.
With its high total quality Qt the driver requires some equalization in order to integrate it properly into a LR4 transfer function. Also here, no signs of pipe resonances; the stuffing is sufficient.

Impedance plot of the woofer in the closed sub baffle:

A Good DIY Day:
Imagine a Saturday morning. It is somewhat hectic because you still have to run some errands, one of which is buying wood for a sub woofer housing. So you sit down for 2 minutes to imagine what proportions might look OK for your design and what volume might be required. After a few seconds of hacking numbers into your calculator you scribble some hardly legible numbers onto a paper and rush to the DIY store to queue up at the counter of the wood shop.
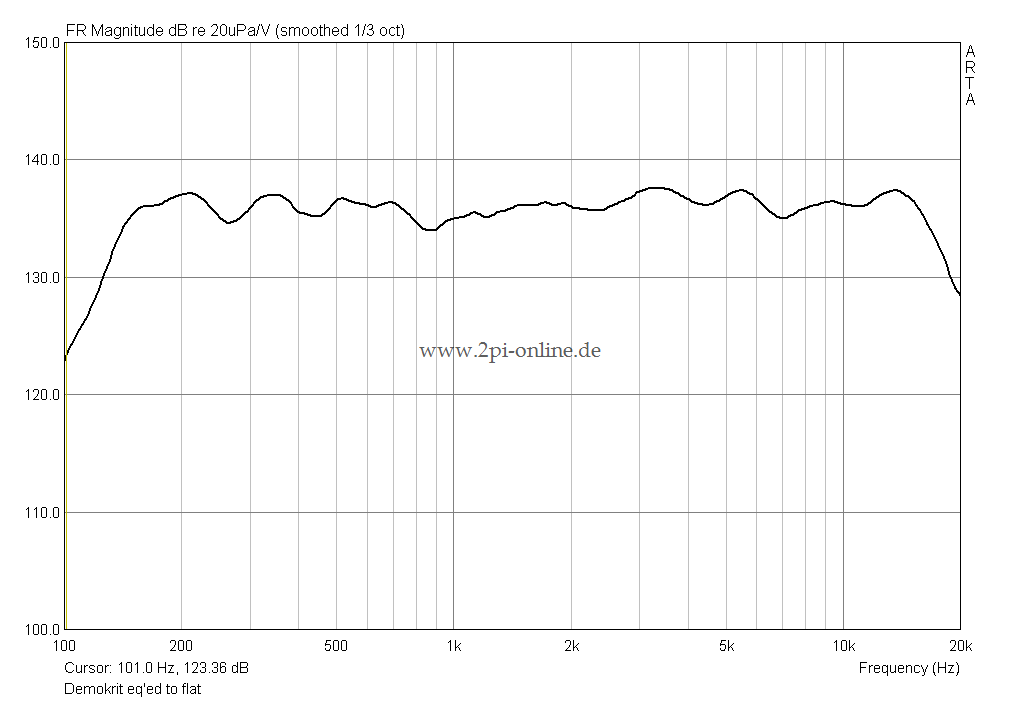
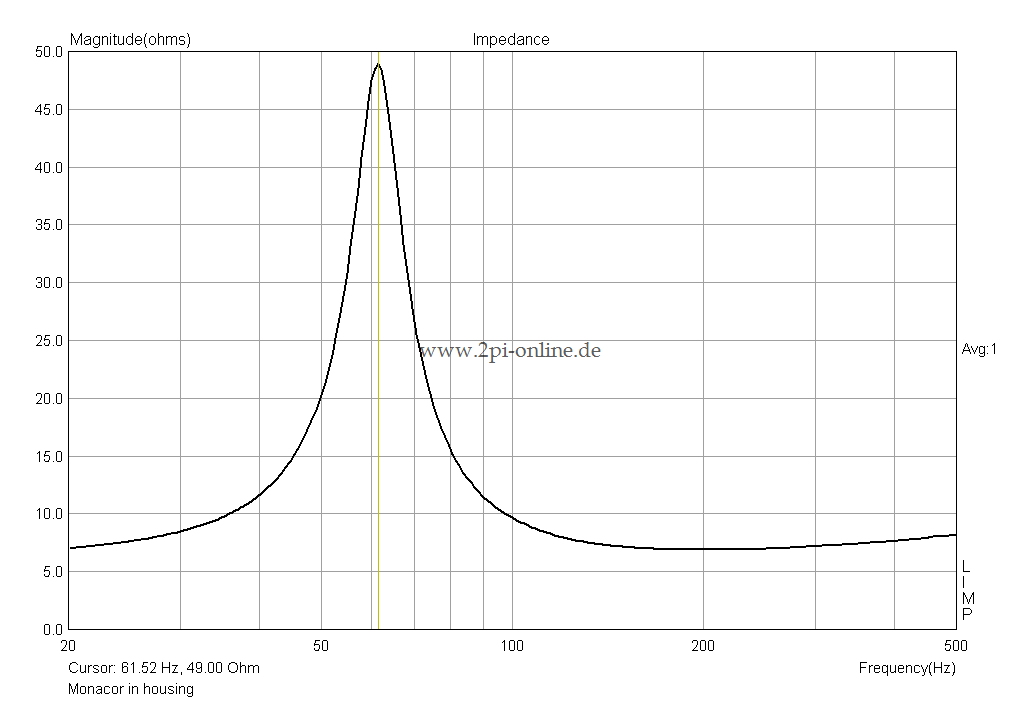
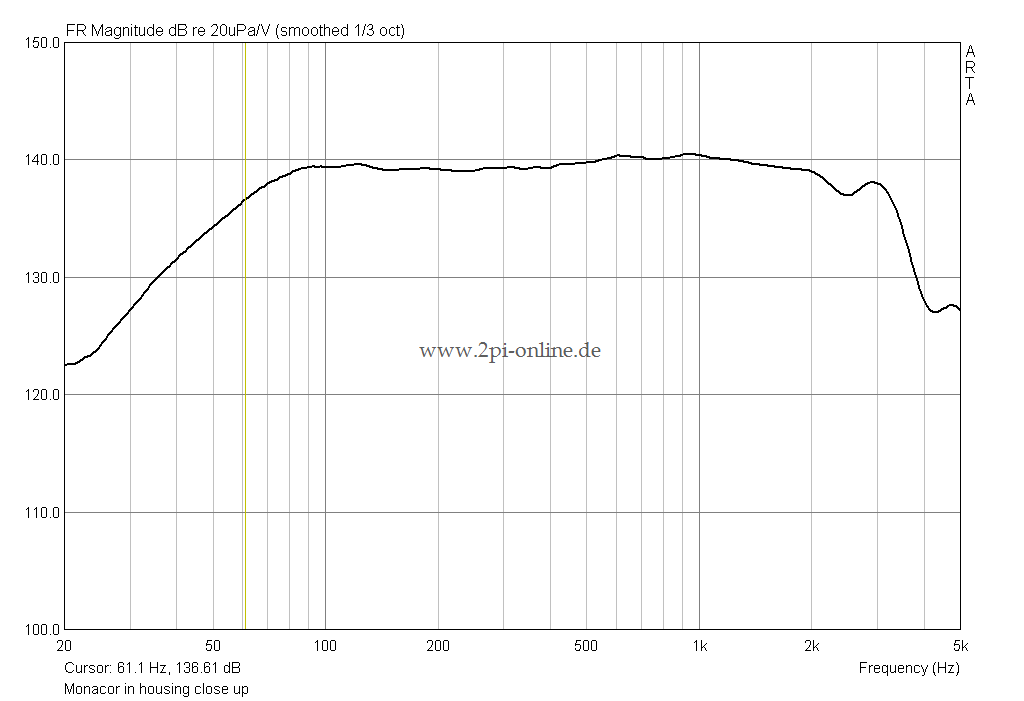
Days later after everything is put together during the measurements you find that you just have built a closed box for a perfectly flat response !!!
You sometimes wonder how the speaker bug might surface one day... J

Anyway, I’m going to equalize the response to get some more bass. Target is within the 30...35Hz region to just not hit one of the first room modes at full SPL.

Last updated 03-Feb-2019

TSP of the driver in the closed box after some break in:

Fs (F0)

140.6 Hz

Re

6.2 W

Le

35 mH

Qmc

1.74

Qec

1.63

Qtc (Q0)

0.84

The 0° near field response of the unequalized sub:

TSP of the woofer in the closed sub baffle:

Fs (F0)

61.4 Hz

Re

6.2 W

Le

760 mH

Qmc

5.60

Qec

0.81

Qtc (Q0)

0.71